Covid-19 elimination impossible, so time for New Zealand to change direction

By Ananish Chaudhuri, Simon Thornley, Michael Jackson.

20/6/2020

877 words

The recent fiasco that allowed people to leave quarantine without testing, risking spread of Covid-19, highlights how nebulous the government’s claim of total elimination always was. The government, in projecting thousands of deaths that never eventuated, has continued with a story that the virus can be eliminated if we all play our part. The façade of a watertight border has been shattered, and the government broke its own quarantine rules. We urgently need to reconsider whether an ‘elimination at all costs’ strategy makes sense, as many other countries are moving on and opening up their borders.

Like other coronaviruses, Covid-19 is here to stay and a vaccine will be a long time coming. Studies show that respiratory viruses are ubiquitous. Over two years, in a cohort of 214 people who were sampled every week in New York, 70% had at least one positive test for a respiratory virus, with the vast majority having few symptoms of infection.

And even if we do get a vaccine, its efficacy is far from guaranteed. Vaccines against seasonal flu are often ineffective since we are often vaccinating against last year’s strain while the virus has already mutated.

Vaccines need to be thoroughly tested before they are offered to the populace. The usual process is to go through three phases of clinical trials. At present, only one vaccine is in phase 2, where safety and dose information is tested in a large group. The critical phase of testing efficacy (phase 3) is the most time-consuming step and often takes years. With the virus now waning in many countries, demonstrating the effectiveness of the vaccine will be difficult, since exposure to the virus will be rare. The sooner we face up to this fact, the better off we will all be. Sooner or later, we will have more cases; at least ripples, if not a wave. We will need to learn to tolerate further cases.

However, based on what we know about the virus at this point, there is no reason to panic. First, contrary to what was claimed earlier, the infection fatality rate of Covid-19 is around 0.25 percent. Many people who contract the virus show few symptoms and the age distribution of fatality with the virus is similar to day-to-day life. Serological tests are telling us that a much larger proportion of the population has immunity against the virus. Even in those who test negative, a high proportion are showing other signs of immunity, through a separate cell-mediated pathway. With more of us already protected, it is harder for the virus to spread.

Second, the most at risk are the elderly, especially those who are frail with other illnesses. This does not mean that we should be willing to sacrifice our parents and grandparents. It simply means that we need to exercise greater caution around the elderly, particularly those in care homes and in hospitals. The majority of deaths with Covid-19 have been in rest homes. Conversely, this also means that we don’t need to worry too much about the young and the healthy. Children especially seem virtually immune to the disease.

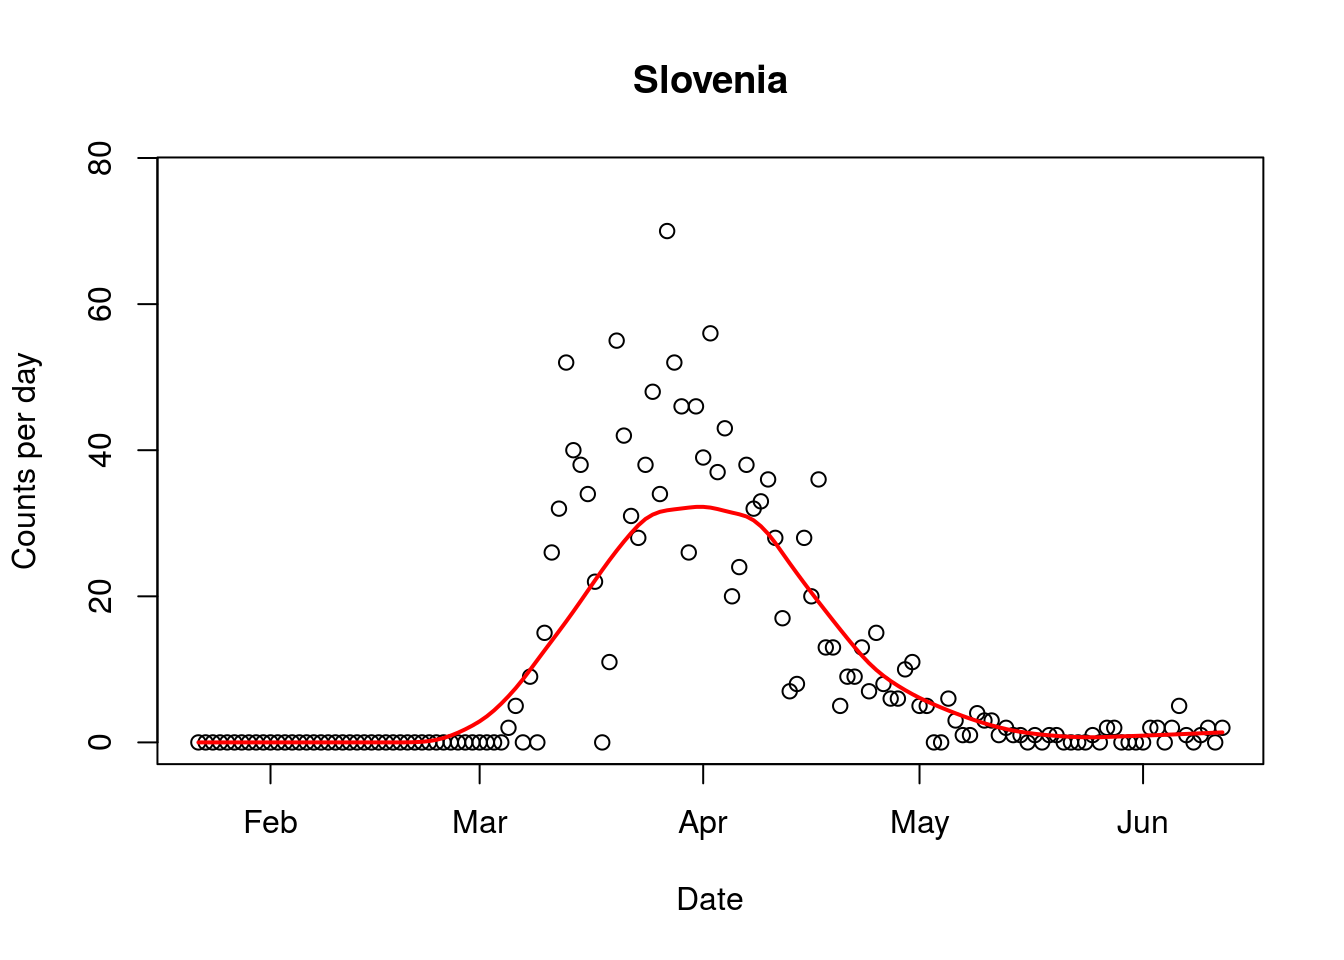
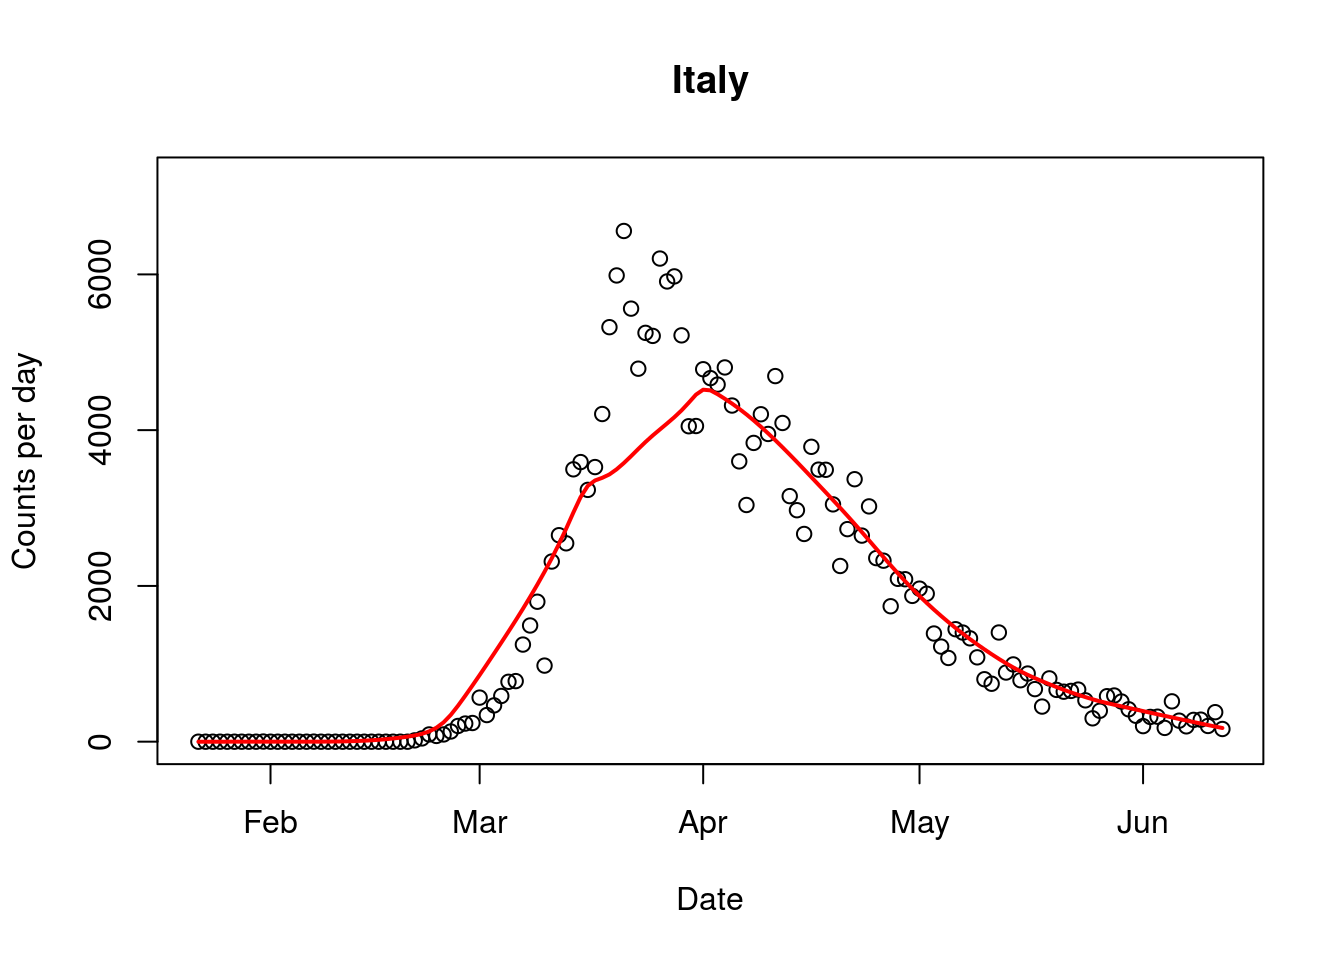
Third, countries all around the world have started opening up. Slovenia has opened its border with Italy, the hardest hit country. The government of Slovenia has declared the epidemic over and is now rather prioritising economic recovery. Across Europe countries are moving to open up their borders, as their governments reassess the risk posed by the virus.

Given this, it seems bizarre that our border is still tightly closed, even with our Pacific neighbours including Cook Islands, a state that is associated with New Zealand. The Cook Islands earns 80% of its revenue from tourism mostly from New Zealanders who holiday there.

Lockdowns are not and never were a panacea. There is very little evidence that lockdowns mitigate the spread. The theory indicates that they slow cases down, rather than reduce overall numbers. Our firm lockdown will cause a significant economic misery with public debt climbing to more than 50% of our GDP in about 2 years’ time. Unemployment will increase sharply and it is well documented that higher unemployment lowers life expectancy, not to mention potential self-harm.

Current predictions are for a 15.8% drop in GDP in the second quarter of the year, suggesting that the Finance Minister’s suggestion of a 4.8% drop during the budget presentation was underestimated.

Behind the scenes, lockdowns, here and elsewhere, are causing havoc. The evidence is emerging gradually. Required tests and surgeries have been postponed and vaccinations have been delayed. Both lives and livelihoods have taken a hit. Around the world, about 80 million children have not been vaccinated leading to a sharp increase in measles, diphtheria and cholera.

It is now time to take stock. The government has broken its own rules to eliminate the virus. Simultaneously, Covid-19 is not as dangerous as it was first thought to be. Serology tests overseas clearly show that the virus has got to many more people than appreciated. We urgently need to assess our own population’s susceptibility to the virus, as we reconsider the border question. It is time for recalibration of the threat, and to prioritise flattening the economic recession curve, rather than doubling down on a fragile and myopic vision of elimination.

A request for balanced analysis and reporting

Drs Michael Jackson and Simon Thornley

A recent article in a New Zealand newspaper claims that Sweden’s approach to managing the Covid pandemic means that “56,000 more people may yet die”. We believe the article is misleading because:

  1. The author assumes an ‘infection fatality proportion’ (IFP) of 1% and states it’s the “current best estimate”. This estimate is derived from seroprevalence studies from just two countries (France and Spain – both with high per capita death rates). But, the Centre for Disease Control’s (CDC) recent best estimate is 0.26% (four times lower). A summary of studies (19 May) by Professor John Ioannidis that included studies from Asia, Europe, and North and South America derived an estimate of between 0.02% to 0.40%. This mirrors the IFR provided by the Centre for Evidence-Based Medicine at Oxford University. We believe the use of a high IFP is misleading as it produces an estimate that wasn’t based on current best estimates.
  2. The author does not include any commentary about the recent identification of cross-reactive T-cells. The paper’s findings (published May 14 and before the author’s article was published) indicate between 40-60% of a population may not even be susceptible to Covid-19 due to prior exposure to other coronaviruses that cause the common cold. This has important implications, as it lowers the number of people susceptible to infection. More recently (we acknowledge after the article was published), one of the world’s most influential neuroscientists and statisticians, Professor Karl Friston (University College London) said the figure could be as high as 80%. The inclusion of this information would have allowed for the re-calculation of an estimated fatality rate and provided the reader with further information about the uncertainty of the author’s predictions.
  3. The author assumes that 60% of a population needs to be have been infected or vaccinated to achieve herd immunity. But some are calculating it at 40% based on Sweden-specific data, not generic inputs. Also, the 60% figure is based on modelling, rather than measured seroprevalence. Given the previous data about T cell immunity and cross-reactivity of other antibodies, the true population immunity is likely to be much higher than seroprevalence surveys indicate. Again, this paints a more negative picture and doesn’t present the reader with a balanced view.
  4. The author states “After completing this article, a new study has reported that the proportion of people in Stockholm with antibodies to Covid-19 is only 7.3 per 100 people”. But an internet search will tell that the 7.3% figure “reflects the state of the epidemic earlier in April”. That’s a whole month before the article was written and when the total number of deaths in Sweden was around 1000. Sweden’s Public Health Agency estimates the figure would now be about 20% but this isn’t mentioned by the author.
  5. The author does not attempt to consider how his prediction of 56,000 extra deaths matches actual recorded data and trends for Covid-19 in Sweden (figure). With 4,874 deaths currently, and a clear downward trend (also evident when the author published his article), the author’s prediction is unrealistic.

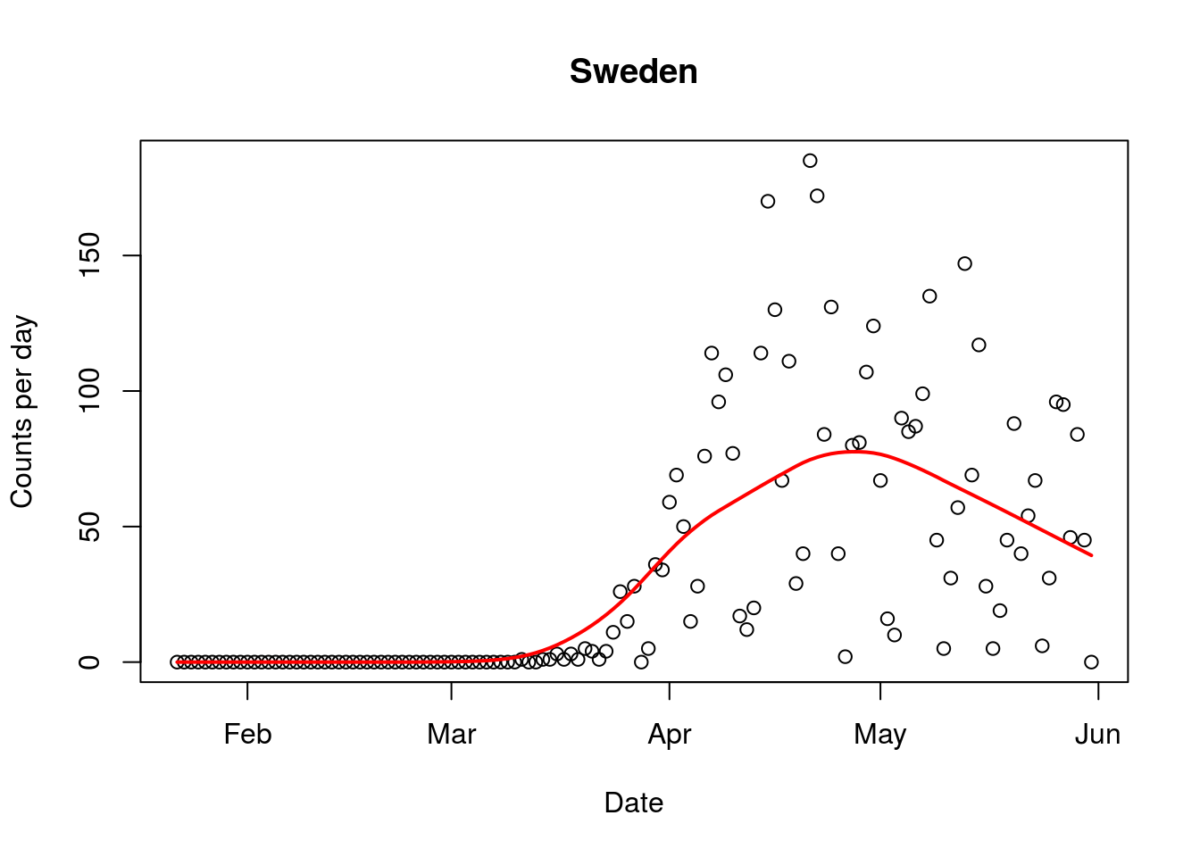
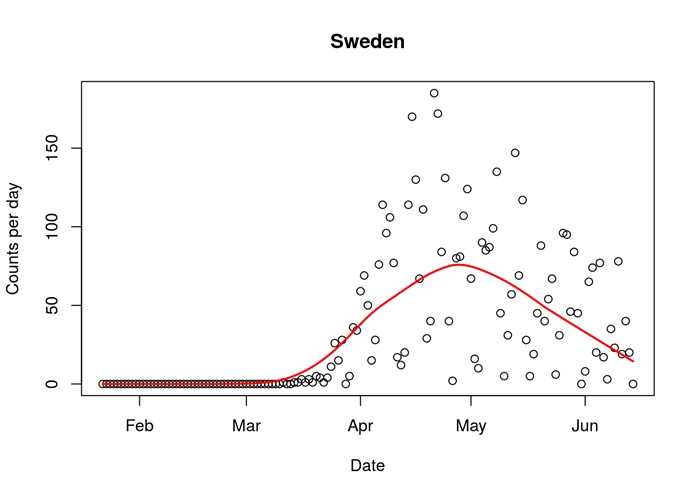
Figure. Covid-19 daily mortality in Sweden (16/6/2020). Line indicates trend.

  1. The author claims that Sweden’s economy hasn’t fared any better than its neighbours, despite its more relaxed approach. Again, this is misleading. While this may be true for Denmark and Norway (note Norway now say they could have achieved the same results without a lockdown), Sweden’s projected downturn (1% GDP) is less than Germany (6.5%), the Netherlands (6.8%), the EU as a whole (7.4%), Belgium (8%), France (8.2%), Croatia, (9.1%), Spain (9.4%), Italy (9.5%), Greece (9.7%) and the UK (up to 14%). For comparison, the New Zealand government is predicting a downturn of around 10%. You may also be surprised to hear Sweden’s economy actually grew in the first quarter of 2020 compared to declines across Europe. The UK’s economy, for example, contracted by 2% over the same period.

We are not, here, looking to justify of Sweden’s approach. Only time will tell if Sweden took the right one. We are simply asking that commentators present their work in a balanced, evidence-based way – one that draws the reader’s attention to the complexity and uncertainty in their projections. Figures like “60,000 deaths” are headline-grabbing but are based on incomplete and overly simplistic modelling. They are not ‘reasonable best estimates” based and clearly contradict observed trends.

Learning from new Covid-19 data

Simon Thornley

15/6/2020

Words: 670

In the response to Covid-19, it is easy to forget that our knowledge of the virus is provisional and still evolving. We have seen, for example, that the infection fatality rate, initially given as 3.4%, now with serology data has been dialled back considerably to between 0.02 to 0.40% which is in the range of severe influenza. This updated information brings an inevitable conflict with political decision making, in which actions are often justified at all costs.

We have now seen evidence of this, with the Medical Director of the Royal New Zealand College of General Practitioners, Dr Bryan Betty, stating that New Zealand was staring down the barrel of a “potential health system meltdown.” He continued: “We were literally one week away from that or we were going down a track of lockdown, which actually halted the spread of the coronavirus in New Zealand. You’ve got to remember that at that time we had exponential growth going on… [Our case numbers] were doubling every day.”

On the face of it, this sounds reasonable. We were looking down the barrel… Let’s pull out all the stops.

Several of Betty’s statements deserve scrutiny. The first is that numbers were doubling every day. They weren’t. In the days immediately before lockdown, numbers increased by 4 from 36 to 40 on the 24th of March, an 11% increase, the next day to 50 (25% increase), then level 4 was instituted. Only for one day did numbers at least double (23rd of March).

The statement that we were staring at a health system meltdown is exaggerated. During the so called “crisis”, hospitals had spare capacity. Hospitals were quiet, so quiet in fact, that specialists expressed concern about it. Intensive care units likewise. In fact, we now have the opposite problem with some primary care practitioners going broke owing to lack of demand and the costs of adapting to new service models. Patients with other conditions were clearly foregoing usual care.

The dire modelling, predicted, even with strong mitigation measures, never eventuated. If there is one thing this teaches us, it is that our understanding of the virus needs updating. The 80,000 predicted deaths are an overestimate of the observed mortality number by 3,400 times. In deciding policy responses, we desperately need to take account of the evolving nature of both the science and the available information rather than rely on outdated models.

A scientific approach involves learning from mistakes. The Norwegian Prime Minister, Erna Solberg admitted that she panicked into a decision to close schools and early childhood centres. Similarly, the Director General of Health in the Scandinavian country, Camilla Stoltenberg, stated that they could have achieved the same result by ‘not locking down’.

Here, we see both politicians and health officials learning from mistakes. Rather than being an admission of failure, it is a logical and healthy response to new information. This response contrasts strongly with some of New Zealand’s leaders.

We are rapidly learning that the threat posed by the virus is not as serious as we have been led to believe. New research shows that immunity is likely to be more widespread than we have previously appreciated. Immunity to this virus is also likely since other scientists have found cross-reactivity to other coronaviruses that cause the common cold. Many more of us are likely to have seen the virus than our case numbers indicate.

This new knowledge must lead to an update of policies for the country. We should continue to question whether it still makes sense for us to keep our borders firmly closed in the light of this new information. Serosurveys of New Zealanders would help us judge more accurately the degree of spread of the virus. If the virus has circulated to many more people than we think, and many more are protected than we previously believed, then we can have confidence to open our borders. Slovenia and Italy have already done this for several weeks and thus far they have not had second waves (figure).

Figure. Daily counts of Covid-19 cases for Slovenia and Italy, two European countries with open borders to European Union citizens.

Covid-19 forecaster errors wrecked Govt decision-making

By Simon Thornley, Gerhard Sundborn, Ananish Chaudhuri and Michael Jackson.

It is clear now that estimates of death from the Covid-19 pandemic were exceeded by factors of hundreds, if not thousands. This sparked public and political panic and led to our government enacting one of the most stringent lockdowns in the world.  Te Pūnaha Matatini predicted 80,000 deaths even with mitigation strategies, while the University of Otago team forecast 12,600 to 33,600 deaths.  Their best possible estimate was 5,800 deaths. The models encouraged the government to enact tight control measures. Now, we are largely over the epidemic, although some of the modelers have warned of secondary waves. New Zealand now has 22 ‘official’ Covid-19 deaths – a far cry from the forecast doom and gloom, with at least a 263 fold over estimate at this point. A recent article about Sweden followed suit, predicting a total of 60,000 deaths for that country, and decrying its decision not to lockdown.

How was it possible for these forecasts to be so erroneous? The interesting aspect, reading the modelling now, is that the number infected under each control policy scenario, including lockdown, was about the same. The Matatini group described 89% of the population being ultimately infected under even the most stringent strategy. The moment the handbrake was let off, another outbreak would occur. However, in the paper, the modellers themselves questioned the effect of lockdowns. They wrote:  “In other countries, including those that have instigating (sic.) major lockdowns such as Italy, there is as yet insufficient evidence that this has reduced [the epidemic]”. They then stated that “successful mitigation requires periods of these intensive control measures to be continued for up to 2.5 years before the population acquires a sufficient level of herd immunity.” The conclusion was that lockdowns were buying time for vaccination and learning from other countries. The modelling that justified the lockdowns was itself clearly stating that such policies were far from a panacea.

Models incorporated lockdown measures yet still predicted thousands of deaths. Critics will say that the lockdown is precisely why the models were so inaccurate. We were saved from catastrophe. Several lines of consistent statistical evidence does not, however, support this idea. US States that did not lockdown report lower Covid-19 cases and death rates on average than States that enforced heavier restrictions. Time trends in Europe show that lockdowns prolonged the recovery from the epidemic after these policies were enforced. Closer to home, it is clear that cumulative per capita cases and deaths of Covid-19 are lower for Australia than for New Zealand despite more relaxed restrictions over the Tasman.

The major factors behind these erroneous models include: (1) an overestimate of the infection fatality rate, and (2) a reciprocal underestimate of the immunity of the population.  Mathematical models of infections project the assumptions of the modellers into the future. They are mathematically elegant, but also based on many untested assumptions. Models assume a far greater degree of certainty than is true in reality.

The models used are built for infections which declare themselves, like measles. Covid-19 is different, it produces high rates of infections in people who feel well. Measles primarily affects young children who are unlikely to die from other causes. Covid-19, on the other hand, has shown to be most vicious at the other end of the age spectrum, specifically causing death most frequently in people at a mean age very similar to our life expectancy, about 82 years. This is curious, as it strongly suggests that the virus does not shorten life, since our life expectancy, or average lifespan, is similar with or without the virus on board. There is little mention of this in the Matatini document, and it is relegated to the appendix of the University of Otago report. Instead the Otago group talk of deaths of the magnitude seen in World War I. Given the age differences of deaths in World War I (mean about 27 years), compared to Covid-19, this must surely be classed as exaggeration.

Neither modelling team attempted to quantify loss of life in terms of ‘years of life lost’ (YLL), a standard epidemiological technique for comparing disease burden. Such statistics would have produced a totally different picture than headline death tallies, portrayed simplistically by the media. YLL is the sum of the differences between age at death and median life expectancy and weights death in the young higher than deaths in the old. Since Covid-19 deaths occurred at an average age in the 80s, this method of measurement would have produced a much less striking picture than the less sophisticated count that values infant and nonagenarian mortality as equivalent. Years of life lost from Covid-19 are extremely low, and pale in comparison to other risks to health, such as cardiovascular disease, diabetes and cancer.

As in the case of swine flu, antibody tests of the virus, are dialling down the infection fatality rate, to a range similar to influenza (0.03% to 0.5%). This contrasts from the genetic test evidence used by some commentators. This cuts down the dire predictions for Sweden by a large ratio. Since even people without antibodies have evidence of seeing the virus, the true infection fatality ratios are likely to be even lower than those adjusted for antibody tests alone. It is now clear that the dire prediction is very unlikely to be correct, since Sweden is now well into the downward slide of its epidemic curve for Covid-19 deaths (figure). The value of observed data over modelled predictions is demonstrated here.

Figure1 (above). Epidemic curve of Covid-19 deaths in Sweden (1/June/2020). Line represents average trend.

Related to the immunity tests, a strong, and very questionable assumption of the modelling is that we are all, as a population, susceptible to the ‘novel’ virus. Since from early on in the epidemic, it was clear that infection was more likely in the elderly, this was unlikely to be so. Recent evidence from immunologists strongly indicate cross-reactivity between “common cold” coronaviruses and SARS-CoV-2, which was present in at least 30% of people that don’t show other evidence of having seen the disease before. This theory is supported by a study that showed that 34% of a sample of healthy blood donors who did not have antibodies, instead had other evidence of immunity, with reactive T cells to the virus. Also, the finding of test-positive samples in France well before the epidemic ‘officially’ occurred, dents the ‘we are all sitting ducks’ theory.

In trying to make sense of these erroneous predictions we have to ask how this happened? We believe two basic features of the human psyche have been at work. The first of these is loss aversion: the desire to avoid losses that are right in front of us even if it means larger losses elsewhere or further down the road. The second is confirmation bias: that is the tendency to look for evidence that confirms one’s pre-supposition and discounts evidence that calls those beliefs into question. Of course, the 24-hour news-cycle, the cacophony of social media, the need for eyeballs, clicks, likes, tweets and retweets exacerbates these matters, since apocalyptic predictions are more likely to draw attention.

Several lines of evidence give us hope, to counter pessimistic modelling. One thing the inaccuracy of the models teach us is that our understanding of the behaviour of the virus is incomplete. Better understanding should translate to more accurate prediction. Epicurves by country in Europe and many parts of Asia, along with Australia and New Zealand are showing waning epidemics with insignificant secondary peaks. These patterns strongly suggest growing immunity in these countries, despite measured low antibody prevalence in some areas. The high rates of cellular and cross immunity explains this phenomenon. China, a very densely populated country, has now widely opened up after a lockdown and had few secondary waves. Japan is the same, although they had lighter restrictions. The sustained low number of cases when the curve falls strongly indicates that we can safely return to normality much more rapidly than was thought possible.


Why the prejudice against tests for Covid-19 immunity?

Simon Thornley

27/5/2020

Words: 1090

A curious phenomenon has developed in the race to beat Covid-19. Advisors to the government have recently become anti anti-bodies. Before I explain what that means, let me provide some context. While we’ve weathered the initial Covid-19 storm, we now have a more challenging set of questions ahead of us as we decide how far and fast to ease social restrictions and open our borders back up to the world.

One of the most critical is: just how widespread is this virus? If, as the Government’s advisors believe, it’s a case of ‘what you see is what you get’, then our options are limited. But if, as we are seeing around the world, the virus has spread through far more of our population than we are aware, then that changes everything. All of a sudden, we need to radically re-think whether our control measures make sense. The genetic test that we are relying on can tell us if the virus is active in the here and now. That is the focus of the daily case counts. These tests are accurate, and the best for diagnosing cases, but they don’t give us a complete picture.

In almost all infectious diseases, antibody tests play a crucial role in determining who is protected from the germ and who is not. They tell us that a virus or germ has been and gone. They are the fingerprints that the virus leaves behind, and allow us to be better prepared for the next encounter. For Covid-19, we may not otherwise know we have met and dispatched the virus, since not all of us develop symptoms. In Iceland, of the few areas of the world a survey was carried out, rather than only testing sick people, 1% of the population tested positive, but half all these positives were perfectly well. It is now clear that just because we don’t have a fever, runny nose or cough, it doesn’t mean we haven’t seen the virus. For this reason, we simply cannot rely on genetic tests from people with symptoms to tell us how far the virus has spread. To really get a handle on how many of us have seen a virus, we need to not only count active cases, but start measuring people who have seen the virus before with antibodies.

New Zealand is now at a cross-roads. We have two explanations for our results. Professor Michael Baker, one of the main experts advising the government, has expressed that antibody tests “would be a waste of time and resources” since a “vanishingly small” proportion of the population have been exposed. Through Baker’s eyes, the lockdown was astonishingly effective, quashing the virus, while leaving all except the one and a half thousand or so cases sitting ducks waiting for infection to strike. We had better live in fear and shut down the borders hard. This narrative goes with the elimination story. So much for our travel and tourist industry. Sorry Rotorua and Queenstown, we have laid you on the altar as a casualty on the path to vanquishing the virus.

Another explanation for the rise and fall of cases in New Zealand is from growing immunity, rather than from the lockdown. The cases of infection rise as the virus encounters more susceptible people. This is great for the virus until it encounters people who have seen the virus before. Their bodies have wised up, thanks to our miracle antibody factories, and the virus sees the door is shut. Some may not even need antibodies. The innate and cellular immune system, like a razor wire fence, may keep the virus out before the soldier-like antibodies need to be enlisted.

Immunity from other viruses is also likely to play a part. A recent study estimated that half of people who haven’t seen the novel virus before, have T cells that react against it which are primarily directed against ‘common cold’ coronaviruses. The virus looks elsewhere, but the door is shut with the next person, and the next, and it soon has nowhere to go. This has been the way we have defeated almost every other lung virus of equivalent severity to Covid-19 in the past.

Now critics will say there are holes in this immunity theory. If that had really happened, we should have seen chocka intensive care units like in Italy. Well, we may have, or we may not. It is clear that New Zealand is not Milan, London and New York, as we would like to believe. We are simply nowhere near as population-dense as these metropolises.

Surely we would have noticed excess deaths? Or excess people coming to hospital with influenza-like symptoms? Since the deaths from Covid-19 are about the same average age as our life expectancy, we may not have noticed. If we hadn’t tested for it, we would have probably not batted an eyelid. We would have put the death down to the growing list of diseases that were likely to have afflicted the deceased. And it is not as if Covid-19 gives a unique clinical presentation. As a former hospital doctor, I know only too well that patients who present with flu-like illness are extremely common. A recent positive test in a French patient well before the ‘official’ epidemic occurred support this theory of widespread infection.

Teasing out which of these two beliefs to follow is now critical. History may help. In recent memory, a story played out according to the widespread immunity theory. We strongly believed that H1N1 was a killer virus, rapidly spreading out of Mexico. The death rate was astonishingly high initially. The clamour to ‘stamp out’ the virus in New Zealand was long and loud. It was, at least, until needles were put in veins, and antibodies were present in 47% percent of some age groups. These tests established that many New Zealanders had seen the virus and the chorus to defeat the virus lost its stuffing.

Evidence from other countries supports the idea of widespread immunity. The very small secondary overseas outbreaks, such as in China and the Australian state of Victoria are further evidence that widespread immunity is growing. If, instead, immunity were sparse, we should expect many further large outbreaks. Other commentators have condemned the low accuracy of Covid-19 tests, however, Roche now has produced a test that has sensitivity and specificity values approaching perfection (100%) that has now got widespread acceptance in Europe. Not even many of our established antibody tests have achieved this.

The philosopher George Santayana reasoned, “those who cannot remember the past are condemned to repeat it.” At this crucial juncture, history indicates that the value of antibody tests and the idea of growing immunity cannot be so easily dismissed. If the virus is more widespread than the genetic tests indicate, we need to urgently reconsider whether or not border closures and social restrictions are really worthwhile.


What should we do when we get another wave of Covid-19 cases?

Simon Thornley

15/5/2020

New Zealand has now progressively opened up, and we are now at level two. The next item to consider is what happens if we have another cluster of cases? What if the number of cases rises steeply? The government has stated that it has achieved ‘elimination’ of the virus, although there are dribs and drabs of new cases, mostly related to known sources. Recently, outbreaks occurred in Hokkaido, Japan, after lockdown was relaxed. The Northern Japanese island locked down for a second time in response to this second wave. Should we follow suit?

Our response depends on the answer to a number of questions. These include:

  • How effective are lockdowns?
  • How do similar viruses behave?
  • How widespread is immunity?
  • What are the risks to our health?

On the questions of the efficacy of lockdowns, there is likely to be ongoing squabbles, which will inevitably spill a lot of academic ink. We now have some compelling evidence that lockdowns in Europe were not especially effective. The trajectory of the epidemic was already declining in many countries when lockdowns were implemented, and the author of the article concluded that lockdowns were unlikely to have saved lives. Other evidence, such as a comparison of US States, that are either under lockdown or not reinforces this view. This analysis has now been subject to major revisions and re-analysis, but the conclusion remains the same – per capita cases and deaths from Covid-19 in each State are not materially different under either policy. The main factor linked to cases and deaths was testing rates. The more tests that were carried out by State, the more cases were found. Closer to home, our New Zealand – Australia comparison, in which New Zealand locked down harder and tighter than our cousins over the Tasman did not support the “hard lockdown” theory.

It is hard to believe with the Covid-19 blinkers on, but there are a number of other coronaviruses that have been circulating for many years that we pay little attention to. As well as the deadly SARS that has been eliminated, there are other coronaviruses that we have been living with for many years that have escaped our gaze. These latter examples are more similar to Covid-19 than SARS and MERS. These coronaviruses, including HCoV-229E, HCoV-HKU1 and HCoV-OC43 have a history of causing fatalities in resthome populations, like our new virus on the block. These viruses have now become endemic with winter seasonal peaks. With these similarities, it is likely that we will have to learn to live with future Covid-19 cases, particularly with winter around the corner.

The risk of future waves is likely to be related to the extent of our exposure to the virus. Tests of immunity in hard hit countries are returning immunity levels of about 5%, such as in Spain. Other tests of cell mediated immunity suggest higher real levels of immunity than those obtained from antibody tests alone. In Germany, 34% of antibody negative healthy donors showed markers of cellular immunity. In New Zealand, we don’t yet know our immune status, since we haven’t tested for it. With the comparative evidence that indicates that lockdowns are not especially effective, the fall in case numbers in New Zealand strongly indicates that widespread immunity is rising. The rise, fall and now low number of cases in China, with only smaller contained outbreaks after the initial peak, suggest that immunity is sustained, at least in the medium term.

We also need to consider how much of a threat the virus poses. In even hard hit countries, for the majority of working age people, the risk of death from the virus is about the same as a daily thirty kilometer trip by car. For those under the age of forty, the mortality risk is extremely low. We now know that hospitals in Australasia were never stretched, even at the epidemic’s peak. It simply makes little sense to squirrel children and working age people away, when the economic effects of lockdowns are ruinous.

The evidence that I see simply does not add up to an endorsement of further lockdowns. The elderly, particularly those who live in rest homes, deserve the greatest protection we can afford. For the rest of us, we can safely get on with our lives and progressively open up the country, even in the face of further cases.

Video: epidemiologist’s take on Covid-19

Dr. Simon Thornley

  • Deaths due to coronavirus have been exaggerated
  • Mean age of death – 80 years old

What you need to know about Covid19 serology

By Simon Thornley

19 May 2020

Why does New Zealand need a serosurvey?

New Zealand urgently needs to test for antibodies to Covid-19. The standard test for Covid-19 at present is a genetic test that only detects whether or not the virus is currently in the body. Serology is a test of a person’s immune response to the virus and persists long after the virus has disappeared. This test gives important information about who in the community has recovered from infection and is thus unlikely to get the infection and pass it on to others. The overwhelming picture from this information is that the virus is much more widespread than is shown from genetic test positive cases.

In the response to swine flu in 2009, a serosurvey provided crucial information to dial back the clamour to stamp out the virus, since that survey showed that the virus was much more widespread than initially thought. As a consequence, it also followed that the virus was much less deadly than initially believed.

We can now count a total of 18 regions or countries that have conducted serological surveys and reported results in English to determine the extent of population exposure to the virus (Table). The proportion of the population who were found to have positive Covid-19 antibodies ranged from between 0.5%  in Colorado to 25.9% in Northern France. In some studies, the rate of positivity increased substantially as the study progressed. Even in the low prevalence regions, these findings strongly indicate that the virus is widespread and unlikely to be amenable to an elimination strategy.

Table 1. Prevalence of positive antibody tests to Covid-19 in surveys from around the world.

Region, Country Sample size Prevalence (%)
Northern France 171 25.9%
Guilan, Iran 552 22.0%
Gangelt, Germany NA 14.0%
New York State, USA 15000 12.3%
Barcelona, Spain 578 11.2%
Wuhan, China 1402 10.0%
Aspen Colorado, USA 198 9.9%
Miami-Dade, USA 1400 6.0%
Switzerland, Geneva 760 5.5%
Los Angeles County, USA NA 4.1%
Finland 147 3.4%
Kobe, Japan 1000 3.3%
Moscow, Russia 1000 3.0%
Santa Clara, USA 3324 2.8%
Netherlands 7361 2.7%
Denmark 9496 1.7%
Colorado, USA 5455 0.5%

NA: not available.

What are antibodies?

Antibodies are like keys in a lock that the body makes in response to viruses and other bacteria. Antibodies only fit a specific virus or bacteria. The shape of the antibody locks on to the microbe so that the body’s immune system can more easily eliminate the virus. Once a high proportion of the community have antibodies to the virus, it becomes very difficult for the virus to spread throughout the community, since it is hard for the virus to find new susceptible people to spread to.

Antibody tests are generally not used to diagnose the infection, since there may be a delay of one to three weeks from the time of infectiousness with the virus to the time that antibodies are generated by the body. Genetic tests, such as PCR, are usually used for making the diagnosis as they are positive earlier in the course of the illness.

What sort of antibody tests are available for Covid-19?

An antibody test generally involves the collection of venous blood or a finger prick to collect capillary blood. A number of test kits have been authorised by the US Food and Drug Administration for use for Covid-19. The Center for Disease Control has developed a test which is reliable for detecting SARS-CoV-2. The test is claimed by the organisation to be 99% sensitive (low false-negative rate) and 96% specific (low false-positive rate).

At present, tests of immunity are mainly recommended for assessing the extent of infection, and what proportion of the population has had mild disease from the virus. Until more information comes to light, researchers are not certain that test-positive individuals are unable to be re-infected, although this is likely to be true.

Are there other types of immunity to Covid-19 apart from antibodies?

As well as using antibodies which come from “B” white blood cells, our immune system also has “T” cells that recognise the virus directly, without the need for antibodies. A recent study from Germany has demonstrated that 83% of genetic test positive Covid-19 cases tested positive for T cells that react to the virus. Also, 34% of healthy blood donors, who were test-negative for antibodies, had evidence of reactive T cells, but at lower levels than cases. It is likely that these T cells confer some immunity to the virus, but it is unclear to what extent such people are protected.

What is the NZ government experience of antibody tests?

A wide range are available, but none have been rigorously tested in New Zealand yet. In order to be confident that these tests are useful, media interviews suggest that the government requires local evidence of testing their accuracy, despite overseas studies showing excellent accuracy with some tests. A number of tests are now endorsed by regulatory agencies in the United States.

If someone tests positive for antibodies, does that prove immunity?

The long term immunity associated with Covid-19 antibodies is not known. It is likely that they confer partial immunity, as seen with other antibodies for coronaviruses. This depends on the dose and route of administration. For example, in an animal study, mice administered coronavirus in the nose maintained immunity for at least 12 months, however, those that had exposure to the virus by mouth had high levels of immunity at one months, but lower levels at 6 and 12 months.

Conclusion

New Zealand urgently needs to test for antibodies to determine community exposure to the virus. If antibody levels are high, then this suggests that the virus is widespread. This also means that the virus is much less deadly than we feared.


Mean age of Covid-19 death equal to average life expectancy

5 April 2020

Simon Thornley

To understand the risks of ending lockdown, it is useful to think of a worst-case scenario. What would happen if ending lockdown led to a fate like Spain, Italy and New York.

A well-known epidemiologist has calculated the answer. For individuals aged less than 65 years, even in ‘pandemic hotbeds’, the risk of dying during the outbreak in hard hit European countries, is about the same as that associated with driving a car between 15 and 100 kilometres per day, throughout the pandemic. For people aged forty or younger, the risk is almost zero. Females have a risk two to three times lower than for males. For people aged younger than 65 years, with no medical conditions, the risk of death is extremely low, with this group contributing only 1/100 of all Covid-19 deaths.

Underscoring the low risk of death, the authors of the study noted that the mean age of death is approximately equal to the average life expectancy at each center. The exact ages of cases are not given for New Zealand cases, but if these are fixed at their midpoint for those for whom only a decade is given, the mean age of death is 81.6 years. This very closely approximates New Zealand’s life expectancy of 82 years. Since the numbers are so close, it is very difficult to argue that the virus is causing early death. In fact, such a pattern is replicated in almost all countries heavily affected by Covid-19. The risk of death in people aged less than 65 years was at least 92% lower compared to their older counterparts in eleven hard hit Covid-19 regions.

This analysis must force us to ask difficult questions, such as if our population of working age are at so low risk, why are we locking down our entire population? If the risks posed by the virus are so low, what are the downsides of locking down? Why are we closing our borders, and devastating our economy due to such a threat? On the basis of such a threat, why are we so obsessed with eliminating the virus?

There are really two choices that continue to be open to us to contain the virus, in the case of increased spread. These two combinations are ongoing lockdowns, or opening up the majority of society, returning us to work and school and protecting the vulnerable. The question of the closure of our borders continues to loom, as we consider whether we can remain cut off from the rest of the world or we work toward a sort of Australasian bubble.

The lockdown affects people of all ages, taking children away from school and workers away from their jobs. In contrast, protecting the vulnerable largely means that people over working age, past their 65th birthday are vulnerable.

The toll is starting to mount. In Queenstown, 30% of the population faces unemployment. Now, more than 100,000 kiwis are looking for mortgage relief. The true magnitude of the effect of the lockdown will take some time to be realised.

At the same time that we are dialing back the real risks posed by the virus, the downsides of putting the country in handcuffs are becoming more apparent. We urgently need to get back to work and school and do our utmost to protect the vulnerable.

Covid-19: science should come first and policy second

1 May 2020

Simon Thornley

With much journalistic ink spilled over Covid-19 it is easy to forget that our policies of lockdown and social distancing are based on a belief about the lethality of the virus and its spread.  This belief comes from interpreting evidence. Currently, two main ideas predominate. Although the government has not stated it explicitly, their elimination policy now indicates that Covid-19 cases are contained, and that the virus can be put back in the box. This optimistic picture starkly contrasts with more convincing evidence from overseas that the virus is now well and truly out of the box, being now much more widespread than first thought. While this initially sounds terrible, it is instead good news, as it allows for a more relaxed stance toward the virus.

The government is now treating the disease in a similar fashion to how we have treated measles. Under this model, the vast majority of cases of infections have symptoms, the test is accurate, and we can contain the virus through contact tracing, quarantine and vaccination. This is a good model for infections that ‘declare themselves’ by causing unequivocal disease in cases and where vaccination is available.

The government has reused this model for Covid-19. Superficially, there is some justification, since community surveys of swab testing for coronavirus have all returned negative. The elimination strategy justifies harsh lockdowns which may be severe in the short term, but pay long term dividends. Under this model, the infection fatality proportion, that is the number of deaths divided by the number of people with infection, is (at the time of writing in NZ) 1.6%, well above seasonal flu (~0.1%), and justifies the ‘eliminate’ approach.

While this may sound attractive, several lines of evidence now indicate the virus often doesn’t ‘declare itself’ like measles, and is instead far more widespread than was initially thought. For example, in Iceland, a community survey of the population showed about 1% of the population tested positive for the virus from a nose swab, and about half showed no symptoms, despite the positive test results.

Information from antibody tests adds to the evidence that the virus has well and truly left the box and left its trail circulating in our bloodstream. After infection, the body mounts an immune response. After exposure, we produce antibodies as evidence that we have seen the virus. This blood test is quite different from the genetic nose swab that has so far dominated New Zealand’s ‘elimination’ thinking. The swab results only indicate the presence of the virus at the time the test was taken.

Antibodies give a contrasting picture from nose swab tests. Varying percentages of positive antibodies are reported, but the overwhelming picture is that many more people have recovered from the virus than has been appreciated. The percentage varies between 4% (Santa Clara, California) to 21% in New York city.

Why is this good news? Well, it indicates that exposure to the virus is about 50 to 85 times that observed from nose swab tests alone. In turn, this information dials back New Zealand fatality estimates to about 0.03% of all infected cases. This adjusted mortality rate is no greater than that for seasonal influenza. This is an important reality check on modelling figures which forecast carnage from Covid-19 equivalent to World War I deaths.

These antibody surveys are from overseas, and critics may argue that this does not apply to our New Zealand Covid-19 situation. Features of our Covid-19 cases, however, support the ‘out of the box’ idea. For example, in the recent measles outbreak, sourced from overseas, the majority of cases occurred in Auckland. For Covid-19, however, cases are much more dispersed around New Zealand, with 3% having no apparent link to overseas sources or other cases (44/1,461). In an effort to stamp the virus out, we will be hunting for needles in a very large haystack.

Since the disease is much more widespread than initially thought, then lockdowns are also unlikely to be effective at reducing spread. Recent evidence supports this idea. A comparison of US States showed that regions with social distancing were doing as well or even better on average for Covid-19 case or death rates than those that had a lockdown policy. Per capita cases and death rates were largely determined by a State’s population density – a factor New Zealand has on its side. While it is tempting to compare ourselves with New York, we have a population density more similar to Vermont, Arkansas, Oklahoma and Iowa. States with these population densities have death rates 95% lower than in New York, and are almost identical whether or not the State has locked down.

The government’s idea of a contained virus simply doesn’t gel with recent antibody surveys. The idea of elimination is scientifically unsound. The weight of evidence clearly illustrates that we are dealing with a virus that is more widespread and much less deadly than we feared. Evidence strongly supports us throwing off the lockdown shackles, safely returning to work and school, while doing our utmost to protect our most vulnerable in hospitals and rest homes.