By Simon Thornley, Gerhard Sundborn, Ananish Chaudhuri and Michael Jackson.
It is clear now that estimates of death from the Covid-19 pandemic were exceeded by factors of hundreds, if not thousands. This sparked public and political panic and led to our government enacting one of the most stringent lockdowns in the world. Te Pūnaha Matatini predicted 80,000 deaths even with mitigation strategies, while the University of Otago team forecast 12,600 to 33,600 deaths. Their best possible estimate was 5,800 deaths. The models encouraged the government to enact tight control measures. Now, we are largely over the epidemic, although some of the modelers have warned of secondary waves. New Zealand now has 22 ‘official’ Covid-19 deaths – a far cry from the forecast doom and gloom, with at least a 263 fold over estimate at this point. A recent article about Sweden followed suit, predicting a total of 60,000 deaths for that country, and decrying its decision not to lockdown.
How was it possible for these forecasts to be so erroneous? The interesting aspect, reading the modelling now, is that the number infected under each control policy scenario, including lockdown, was about the same. The Matatini group described 89% of the population being ultimately infected under even the most stringent strategy. The moment the handbrake was let off, another outbreak would occur. However, in the paper, the modellers themselves questioned the effect of lockdowns. They wrote: “In other countries, including those that have instigating (sic.) major lockdowns such as Italy, there is as yet insufficient evidence that this has reduced [the epidemic]”. They then stated that “successful mitigation requires periods of these intensive control measures to be continued for up to 2.5 years before the population acquires a sufficient level of herd immunity.” The conclusion was that lockdowns were buying time for vaccination and learning from other countries. The modelling that justified the lockdowns was itself clearly stating that such policies were far from a panacea.
Models incorporated lockdown measures yet still predicted thousands of deaths. Critics will say that the lockdown is precisely why the models were so inaccurate. We were saved from catastrophe. Several lines of consistent statistical evidence does not, however, support this idea. US States that did not lockdown report lower Covid-19 cases and death rates on average than States that enforced heavier restrictions. Time trends in Europe show that lockdowns prolonged the recovery from the epidemic after these policies were enforced. Closer to home, it is clear that cumulative per capita cases and deaths of Covid-19 are lower for Australia than for New Zealand despite more relaxed restrictions over the Tasman.
The major factors behind these erroneous models include: (1) an overestimate of the infection fatality rate, and (2) a reciprocal underestimate of the immunity of the population. Mathematical models of infections project the assumptions of the modellers into the future. They are mathematically elegant, but also based on many untested assumptions. Models assume a far greater degree of certainty than is true in reality.
The models used are built for infections which declare themselves, like measles. Covid-19 is different, it produces high rates of infections in people who feel well. Measles primarily affects young children who are unlikely to die from other causes. Covid-19, on the other hand, has shown to be most vicious at the other end of the age spectrum, specifically causing death most frequently in people at a mean age very similar to our life expectancy, about 82 years. This is curious, as it strongly suggests that the virus does not shorten life, since our life expectancy, or average lifespan, is similar with or without the virus on board. There is little mention of this in the Matatini document, and it is relegated to the appendix of the University of Otago report. Instead the Otago group talk of deaths of the magnitude seen in World War I. Given the age differences of deaths in World War I (mean about 27 years), compared to Covid-19, this must surely be classed as exaggeration.
Neither modelling team attempted to quantify loss of life in terms of ‘years of life lost’ (YLL), a standard epidemiological technique for comparing disease burden. Such statistics would have produced a totally different picture than headline death tallies, portrayed simplistically by the media. YLL is the sum of the differences between age at death and median life expectancy and weights death in the young higher than deaths in the old. Since Covid-19 deaths occurred at an average age in the 80s, this method of measurement would have produced a much less striking picture than the less sophisticated count that values infant and nonagenarian mortality as equivalent. Years of life lost from Covid-19 are extremely low, and pale in comparison to other risks to health, such as cardiovascular disease, diabetes and cancer.
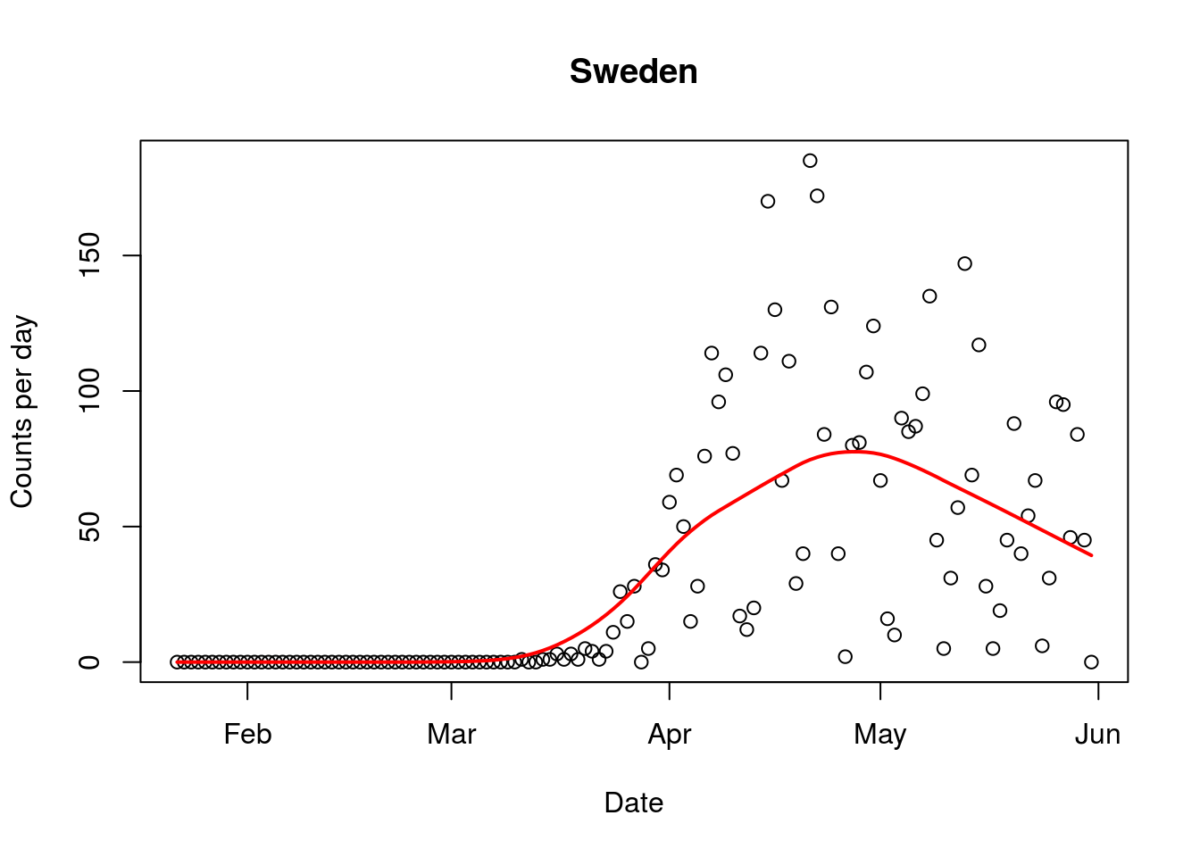
As in the case of swine flu, antibody tests of the virus, are dialling down the infection fatality rate, to a range similar to influenza (0.03% to 0.5%). This contrasts from the genetic test evidence used by some commentators. This cuts down the dire predictions for Sweden by a large ratio. Since even people without antibodies have evidence of seeing the virus, the true infection fatality ratios are likely to be even lower than those adjusted for antibody tests alone. It is now clear that the dire prediction is very unlikely to be correct, since Sweden is now well into the downward slide of its epidemic curve for Covid-19 deaths (figure). The value of observed data over modelled predictions is demonstrated here.
Figure1 (above). Epidemic curve of Covid-19 deaths in Sweden (1/June/2020). Line represents average trend.
Related to the immunity tests, a strong, and very questionable assumption of the modelling is that we are all, as a population, susceptible to the ‘novel’ virus. Since from early on in the epidemic, it was clear that infection was more likely in the elderly, this was unlikely to be so. Recent evidence from immunologists strongly indicate cross-reactivity between “common cold” coronaviruses and SARS-CoV-2, which was present in at least 30% of people that don’t show other evidence of having seen the disease before. This theory is supported by a study that showed that 34% of a sample of healthy blood donors who did not have antibodies, instead had other evidence of immunity, with reactive T cells to the virus. Also, the finding of test-positive samples in France well before the epidemic ‘officially’ occurred, dents the ‘we are all sitting ducks’ theory.
In trying to make sense of these erroneous predictions we have to ask how this happened? We believe two basic features of the human psyche have been at work. The first of these is loss aversion: the desire to avoid losses that are right in front of us even if it means larger losses elsewhere or further down the road. The second is confirmation bias: that is the tendency to look for evidence that confirms one’s pre-supposition and discounts evidence that calls those beliefs into question. Of course, the 24-hour news-cycle, the cacophony of social media, the need for eyeballs, clicks, likes, tweets and retweets exacerbates these matters, since apocalyptic predictions are more likely to draw attention.
Several lines of evidence give us hope, to counter pessimistic modelling. One thing the inaccuracy of the models teach us is that our understanding of the behaviour of the virus is incomplete. Better understanding should translate to more accurate prediction. Epicurves by country in Europe and many parts of Asia, along with Australia and New Zealand are showing waning epidemics with insignificant secondary peaks. These patterns strongly suggest growing immunity in these countries, despite measured low antibody prevalence in some areas. The high rates of cellular and cross immunity explains this phenomenon. China, a very densely populated country, has now widely opened up after a lockdown and had few secondary waves. Japan is the same, although they had lighter restrictions. The sustained low number of cases when the curve falls strongly indicates that we can safely return to normality much more rapidly than was thought possible.