Experts changing their minds as facts against Covid19 mount

Abstract

The Severe Acute Respiratory Syndrome Coronavirus 2 (SARS-CoV-2) has caused the Coronavirus Disease 2019 (COVID-19) worldwide pandemic in 2020. In response, most countries in the world implemented lockdowns, restricting their population’s movements, work, education, gatherings, and general activities in attempt to ‘flatten the curve’ of COVID-19 cases. The public health goal of lockdowns was to save the population from COVID-19 cases and deaths, and to prevent overwhelming health care systems with COVID-19 patients. In this narrative review I explain why I changed my mind about supporting lockdowns. First, I explain how the initial modeling predictions induced fear and crowd-effects [i.e., groupthink]. Second, I summarize important information that has emerged relevant to the modeling, including about infection fatality rate, high-risk groups, herd immunity thresholds, and exit strategies. Third, I describe how reality started sinking in, with information on significant collateral damage due to the response to the pandemic, and information placing the number of deaths in context and perspective. Fourth, I present a cost-benefit analysis of the response to COVID-19 that finds lockdowns are far more harmful to public health than COVID-19 can be. I close with some suggestions for moving forward.

https://www.preprints.org/manuscript/202010.0330/v1

Deaths due to lockdown: UK

Thanks to good record keeping and research in the UK that country is now counting the cost of lockdown on health.

The Spectator reports:

A study by the London School of Hygiene and Tropical Medicine found delayed and cancelled breast cancer treatments will cause between 281 and 344 additional deaths. For colorectal cancer, there were an extra 1,445 to 1,563 deaths, lung cancer an additional 1,235 to 1372 deaths and 330 to 342 more oesophagal cancer deaths.


A University of Leeds study estimated that there have already been an extra 2,085 deaths from heart disease and stroke as a result of people not accessing timely medical help. A study by the University Hospital of Northern Tees reveals that the number of endoscopies — used to investigate and diagnose bowel cancer — fell to just 12 per cent of their normal level between 24 March and 31 May


The National Blood and Transplant Service looked at the period between 23 March and 10 May and found that, compared with the same period in 2019, the number of organ donors fell by 66 per cent and the number of transplants fell by 68 per cent. This year, 87 people died while waiting for an organ transplant, compared with 47 last year.

And in a report by the ONS, an extra 25,472 people have died at home than would otherwise be expected from the average past five years.

Pre-existing immunity is retarding Covid19

Sunetra Gupta talks about her most recent study showing preexisting resistance to Covid19, and that 15-20% sero-positivity in the population could retard Covid19 prevalence and probably already is.

She also refers to some strange behavior of people opposed to looking into these matters.

https://youtu.be/ZCnTtKM6RK8.

Immunity variations explains actual impact of Covid19

Fascinating study shows that removing homogeneity assumptions from population models, and replacing it with variations in virus susceptibility, returns data that better fits the actual impact of Covid19.

The results imply that most of the slowing and reversal of COVID-19 mortality is explained by the build-up of herd immunity.

The estimate of the herd immunity threshold depends on the value specified for the infection fatality ratio (IFR): a value of 0.3% for the IFR gives 15% for the average herd immunity threshold.

Now, compare this to the simplistic exponential models provided to governments across the world, and here in NZ.

https://www.medrxiv.org/conte…/10.1101/2020.09.26.20202267v1

The PCR test is not reliable

Sensitivity of the PCR test creates unreliability which undermines contact tracing, and destabilises policy making.

Jay Bhattacharya explains that the epidemic is too widespread for contact tracing to limit disease spread; that errors in the PCR tests substantially raise the human costs of contact tracing and render it less effective; and that contact tracing incentivises the public to mislead public health authorities.

https://inference-review.com/article/on-the-futility-of-contact-tracing

CDC study finds masks don’t stop Covid19 infection

A CDC study found that wearing a mask made no difference to catching Covid19.

71% of case-patients (ie. infected) and 74% of control-participants (not infected) reported always using cloth face coverings or other mask types when in public.

The CDC didn’t highlight this finding, but the finding that people who caught Covid19 were twice as likely to have gone out to eat or drink.

https://www.cdc.gov/mmwr/volumes/69/wr/mm6936a5.htm

The health cost of lockdown: NZ’s dramatic fall in referrals and tests

The cost of lockdown was missed diagnosis, possibly leading to illnesses going unidentified.

A study of a Dunedin primary care clinic found that during lockdown tests and referrals fell by almost 100%. It was likely not quite this bad across the country, but the MoH won’t report the data.

Referrals 2019: 17   2020: 0.
Lab tests 2019: 61   2020: 1.

https://www.odt.co.nz/news/dunedin/gp-contact-referrals-affected-lockdown-study

Covid19 infection produces antibodies that protect you for at least five months

Big Question answered: It turns out that the antibodies you make when you get Covid19 protect you for at least five month, like most other viruses. This doesn’t include the T-cells and other immunity variations that also protect us.

https://medicalxpress.com/news/2020-10-sars-cov-antibodies-immunity.html

Ioannidis meta study finds the median infection fatality rate is under 0.27%.

Abstract: To estimate the infection fatality rate of coronavirus disease 2019 (COVID-19) from data of seroprevalence studies. Methods Population studies with sample size of at least 500 and published as peer-reviewed papers or preprints as of July 11, 2020 were retrieved from PubMed, preprint servers, and communications with experts. Studies on blood donors were included, but studies on healthcare workers were excluded. The studies were assessed for design features and seroprevalence estimates. Infection fatality rate was estimated from each study dividing the number of COVID-19 deaths at a relevant time point by the number of estimated people infected in each relevant region. Correction was also attempted accounting for the types of antibodies assessed. Secondarily, results from national studies were also examined from preliminary press releases and reports whenever a country had no other data presented in full papers of preprints. Results 36 studies (43 estimates) were identified with usable data to enter into calculations and another 7 preliminary national estimates were also considered for a total of 50 estimates. Seroprevalence estimates ranged from 0.222% to 47%. Infection fatality rates ranged from 0.00% to 1.63% and corrected values ranged from 0.00% to 1.31%. Across 32 different locations, the median infection fatality rate was 0.27% (corrected 0.24%). Most studies were done in pandemic epicenters with high death tolls. Median corrected IFR was 0.10% in locations with COVID-19 population mortality rate less than the global average (<73 deaths per million as of July 12, 2020), 0.27% in locations with 73-500 COVID-19 deaths per million, and 0.90% in locations exceeding 500 COVID-19 deaths per million. Among people <70 years old, infection fatality rates ranged from 0.00% to 0.57% with median of 0.05% across the different locations (corrected median of 0.04%). Conclusions The infection fatality rate of COVID-19 can vary substantially across different locations and this may reflect differences in population age structure and case-mix of infected and deceased patients as well as multiple other factors. Estimates of infection fatality rates inferred from seroprevalence studies tend to be much lower than original speculations made in the early days of the pandemic.

https://www.medrxiv.org/content/10.1101/2020.05.13.20101253v3

What can we learn from Iceland about Covid-19?

Iceland gives us a unique insight into Covid-19 infections since it has one of the highest per capita testing rates in the world, over 10 fold greater than New Zealand.

What’s more they are very open about the severity of cases, and the proportion that need hospital treatment and intensive care.

Iceland has also conducted community surveys of their population. This information is not publicly available in New Zealand. While tables of these figures may be useful, it is sometimes difficult to understand the sense of scale from them.

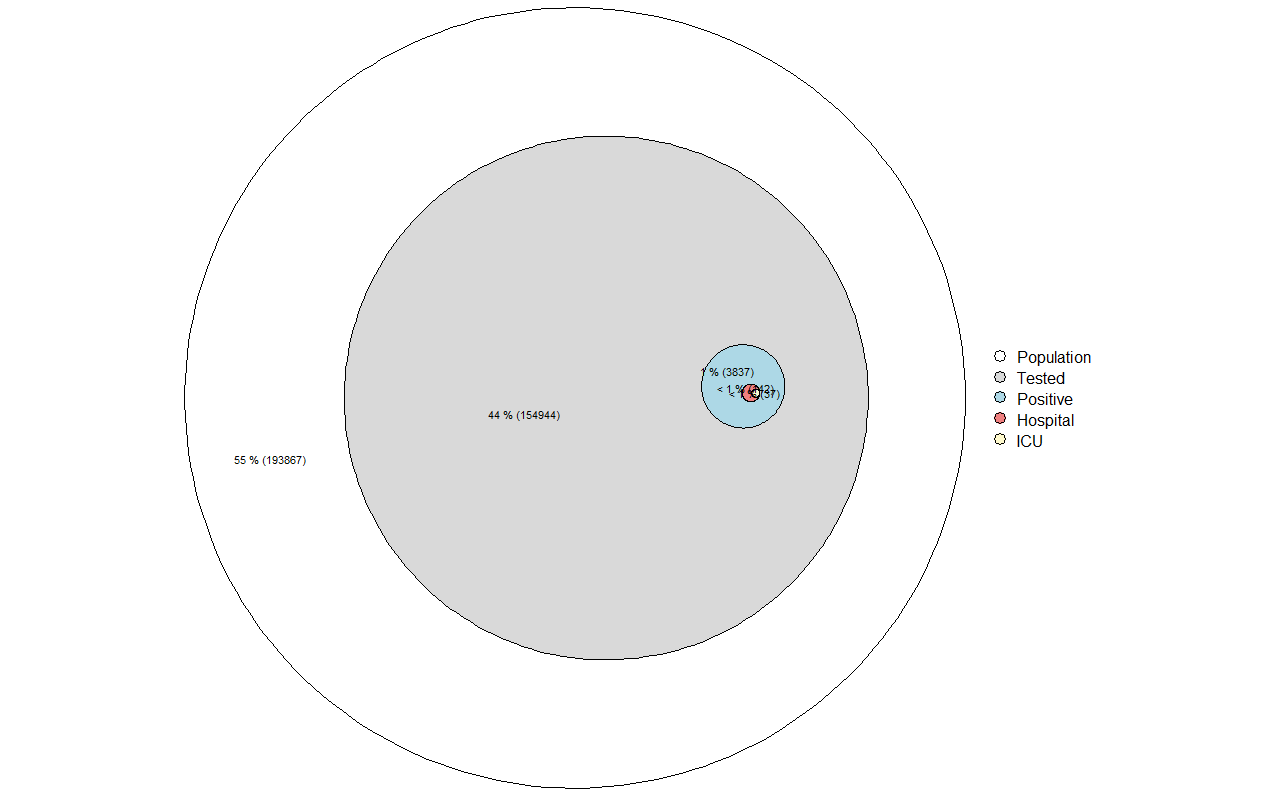
Euler diagrams scale numbers or percentages to an area of a circle or ellipse. Overlapping relationships may also be depicted. The outer circle represents the 356,000 population of the Nordic country, the grey is the roughly 44% of the population who have been tested, the blue indicates the ~4,000 people (2.5% of all tests) who returned positive. The red indicates those who required hospital treatment (~5% of test positives), with the small yellow circle indicating the 1% of test positives who were treated in intensive care.

Deaths (10 at the time of writing – meaning a case fatality ratio of 0.25%) were too small to render on the diagram.

This study, which outlines antibody testing in a sample of 30,576 people in Iceland suggests that half of all PCR + cases were detected. Therefore, the infection fatality ratio is about half of the case-fatality ratio, so about 0.125%.

This diagram illustrates that in Iceland, only ~1/20 positive Covid infections resulted in the need for hospital treatment. With the high rate of per-capita testing, this information gives us a more accurate assessment of the clinical severity of Covid-19 infection than is otherwise available from countries where testing is more directed at only people with cold or flu symptoms. The plot offers a visual sense of the burden of the virus to hospital and intensive care resources.

Iceland data (16/10/20)